
Exploring parachute science in analytical geoscience
An important step for us in looking at how to address inequalities in access was to demonstrate quantitatively the existence and effects of such inequalities in analytical geoscience. In particular we have focused on exploring the extent of parachute science in analytical geoscience.
Parachute science refers to science conducted by researchers from another country from that in which they are working, without local involvement. It’s negative effects include: concentration of expertise (or perceived expertise) away from the areas or communities which are subject to that expertise; ignorance of or exploitation of important local knowledge; lack of credit to local collaborators who may be instrumental to successful field data collection among other things.
We focused on parachute science as it is relatively easy to explore through quantitative data from published and freely available sources and therefore could be rigorously studied in the timeframe of the hackathon.
In order to do this, we turned to the PetDB database. This is an online open access database of igneous geochemistry data. The big advantage of using this as the starting point for our analysis was that each sample recorded in the database has an associated grid reference. This greatly simplified the job of determining which country an article was about. Determining this information directly from the title or tags of an article would be extremely hard to automate reliably and very slow to do manually.
Data extraction
The data for all records in the PetDB database were scraped using a Python script (code here) and the country of the samples determined from the grid reference. For the purposes of our analysis we included any seafloor samples collected within the exclusive economic zone (EEZ) of a country as being from country. The DOIs of the references were used to manually search the Web of Science database, returning 1493 records with valid addresses.
The affiliation of both the first author and of the full author list was determined automatically using a script in the R programming language to string match the addresses to a list of all world countries (code here). This was followed by several stages of semi-automated clean up to deal with mistakes and inconsistencies in the data. At each stage during development of the code, 50 records were randomly chosen and manually checked to assess the accuracy of the matching and only when no problems were found was it judged to be complete. The country for samples, 1st author and all authors were finally standardised to a list of preferred country names (e.g. England, UK, Scotland all became United Kingdom) to allow reliable matching of names.
Analysing the data
The final dataset consists of 1426 references for which the affiliation of all authors and country could be determined. We categorised each of thee as either Domestic, where the first author affiliation and country of sample origin matched; Foreign with local involvement, where the affiliation of someone other than the first author matched the country the samples were from; or Foreign where none of the authors’ affiliations matched the sample country.
To understand if the extent to which parachuate science varies by country, we grouped the data by country of sample origin and for each country calculated the parachute index, defined as the log of the ratio of publications concerning that country which include local researchers to those which include no local researchers (Raja et al., 2021). We also summarise the data by the country of the first author’s affiliation and calculated for each country the proportion of foreign research and the proportion of that foreign research which included local researchers.
Where are the samples from?
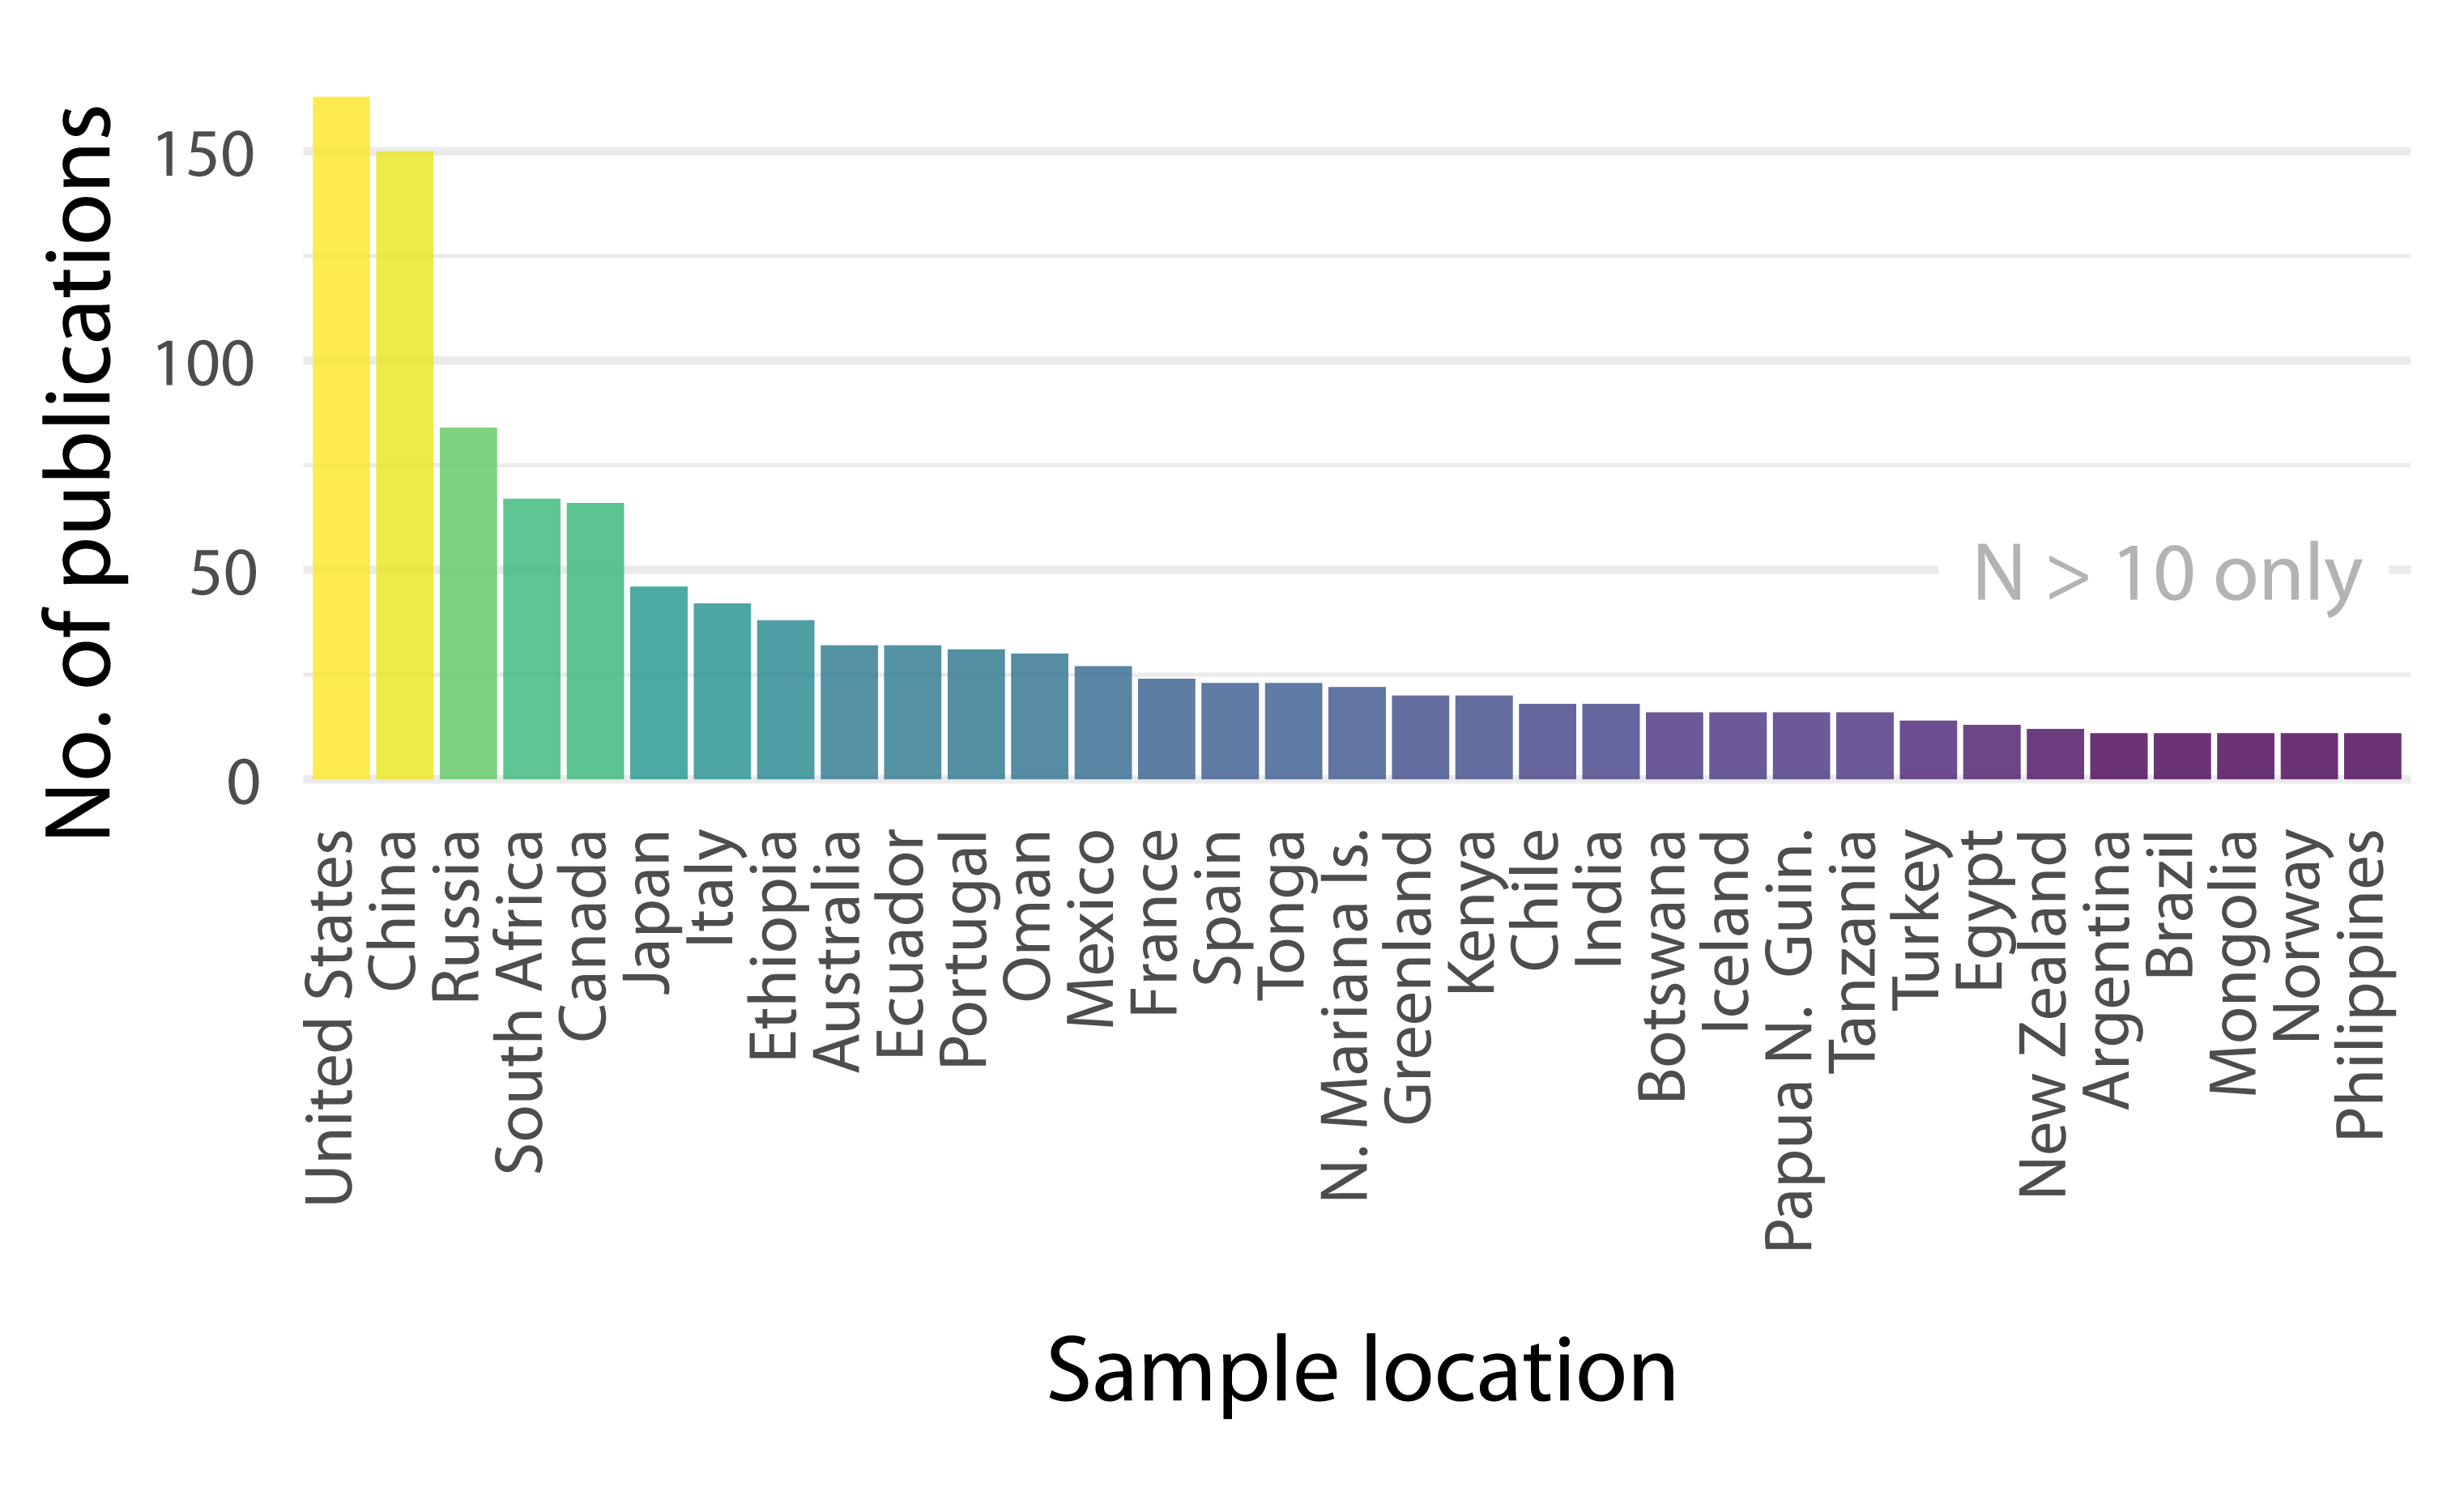 The largest number of publications concern samples from the United
States and China (N>100) with Russia, South Africa and Canada (N>50)
and Japan, Italy, Ethiopia, Australia, Ecuador, Portugal and Oman all
well represented (N>25).
The largest number of publications concern samples from the United
States and China (N>100) with Russia, South Africa and Canada (N>50)
and Japan, Italy, Ethiopia, Australia, Ecuador, Portugal and Oman all
well represented (N>25).
Just from this graph, Ethiopia, Oman, Mexico, and Kenya jump out as being highly represented in the form of samples but (as we will see) little represented in the form of authorship and particularly first authorship. This might tend to suggest issues of “parachute science”.
Parachute index
Plotting the parachute index by country of sample origin gives us insight into the extent to which countries are subject to parachute science. Negative numbers tend to imply a greater degree of parachute science while positive numbers imply a higher degree of domestic research (i.e. research on samples from a given country by researchers in that country).
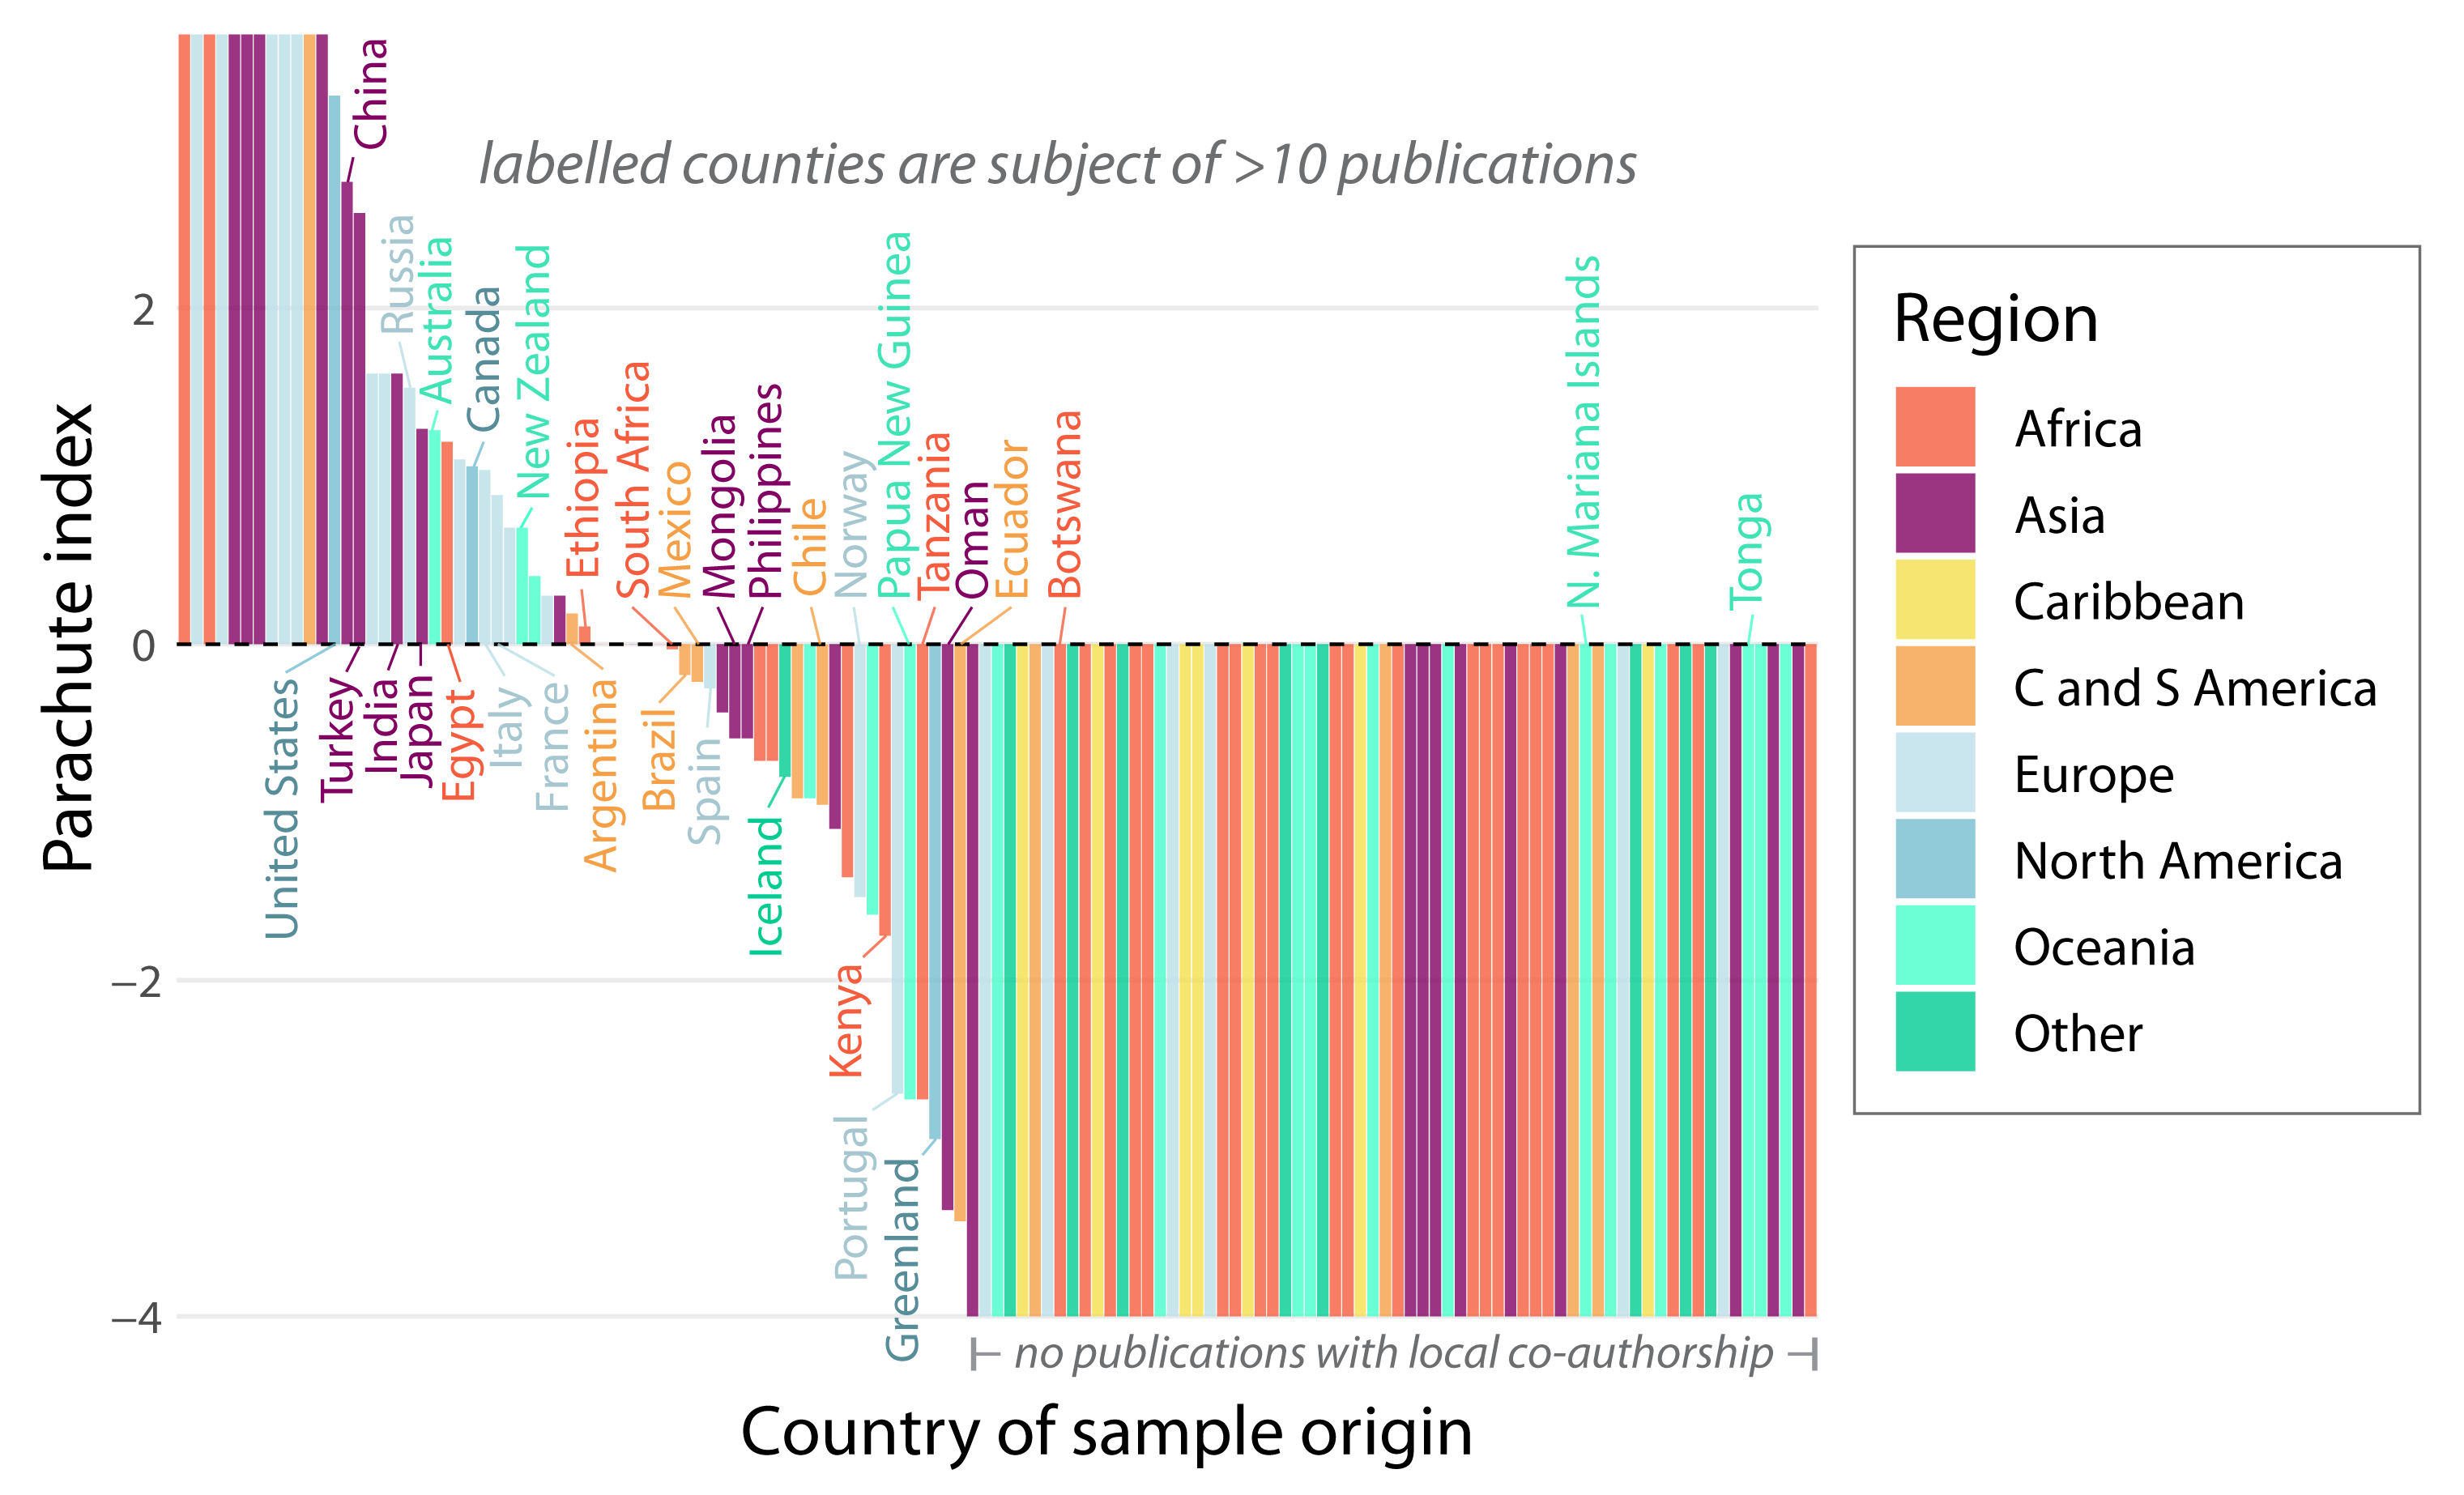
There are two main things clear from this plot. Firstly, notwithstanding a few countries with high positive indices but few total publications at the far left of the plot, the countries with positive indices (showing high rates of local involvement) are dominated by those from Europe, North America and Asia (pale blues and purple) as well as New Zealand and Australia. At the other end of the spectrum on the right hand side of the graph, countries with negative parachute indices (showing high levels of parachute science with no local involvement) tend to be in Africa, Central and South America, the Caribbean and Oceania.
It is particlarly notable just how many countries do not have a single publication with a local co-author. In several cases, including Botswana, Tonga and the N Marianas Islands this is despite 10 or more references in the database concering those countries.
Stats by region
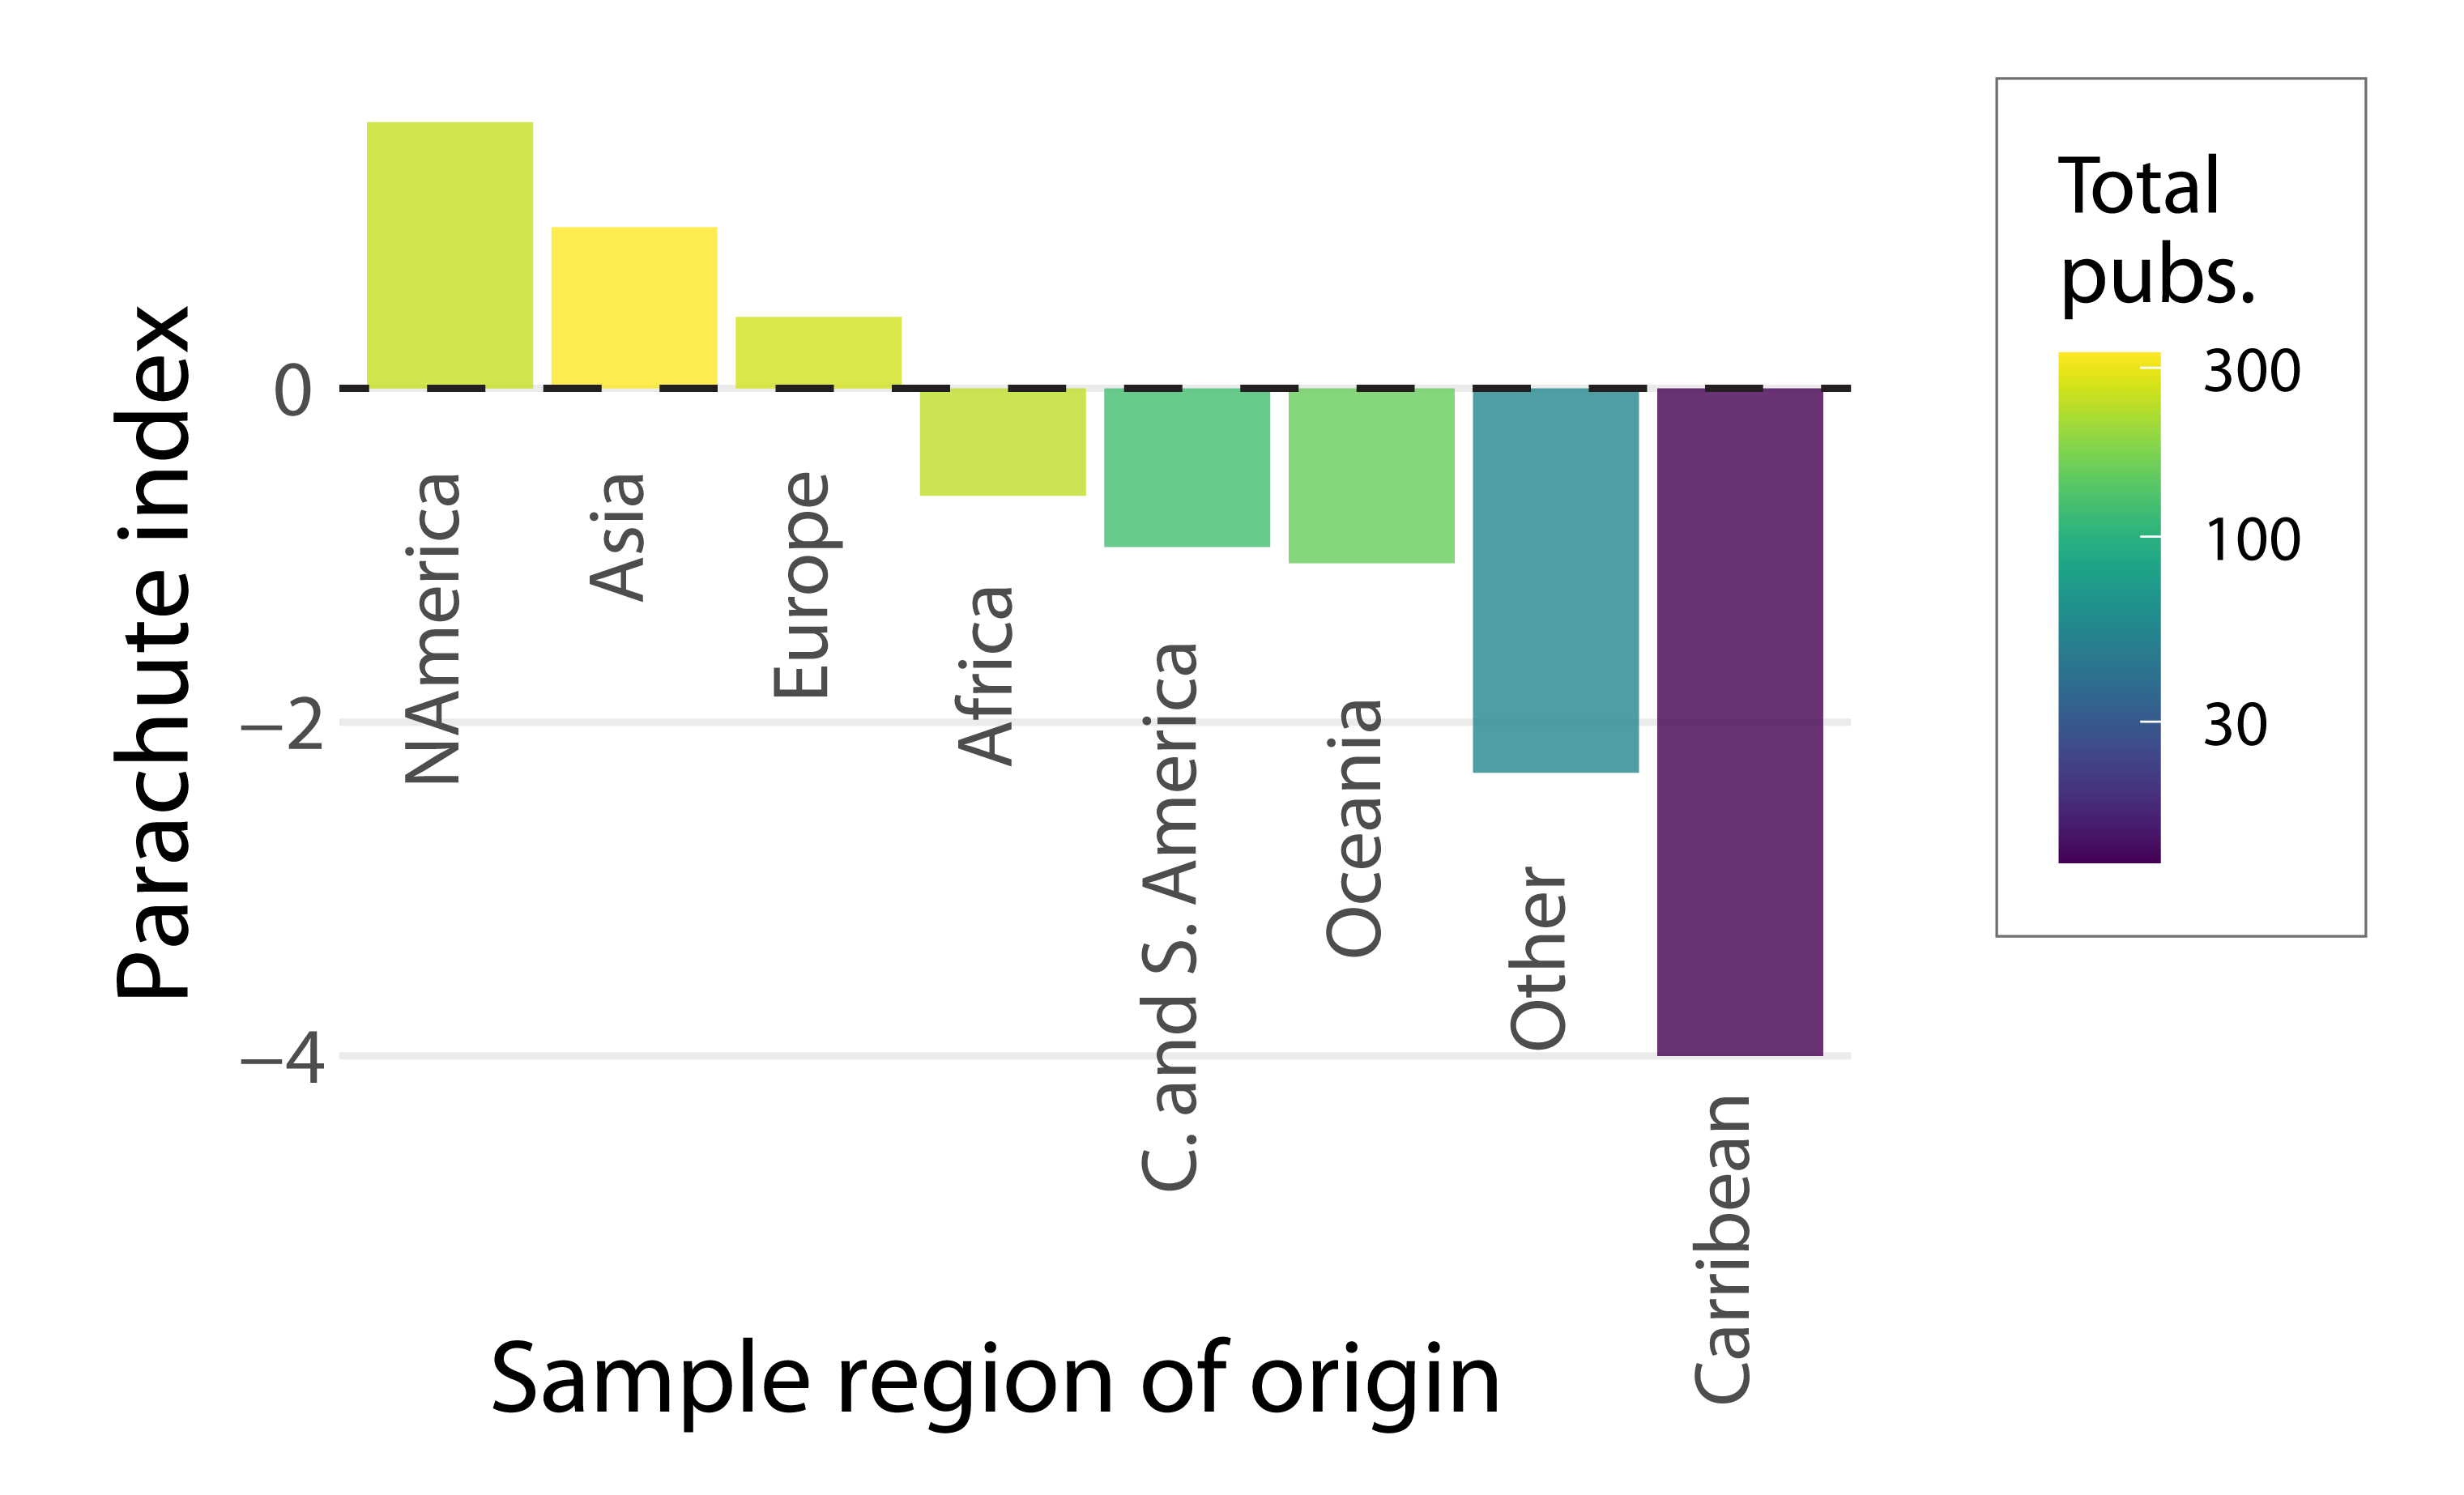
Since there are quite a few countries with a small overall number of publications, these tendencies are perhaps more clearly shown by summarising the parachute index data by regions and plotting the results.
Which countries do the most research in other countries?
It’s also useful to look at the country of the first author. Where are the places doing the most parachute science? (rather than subject to it as the above graphs illustrate)
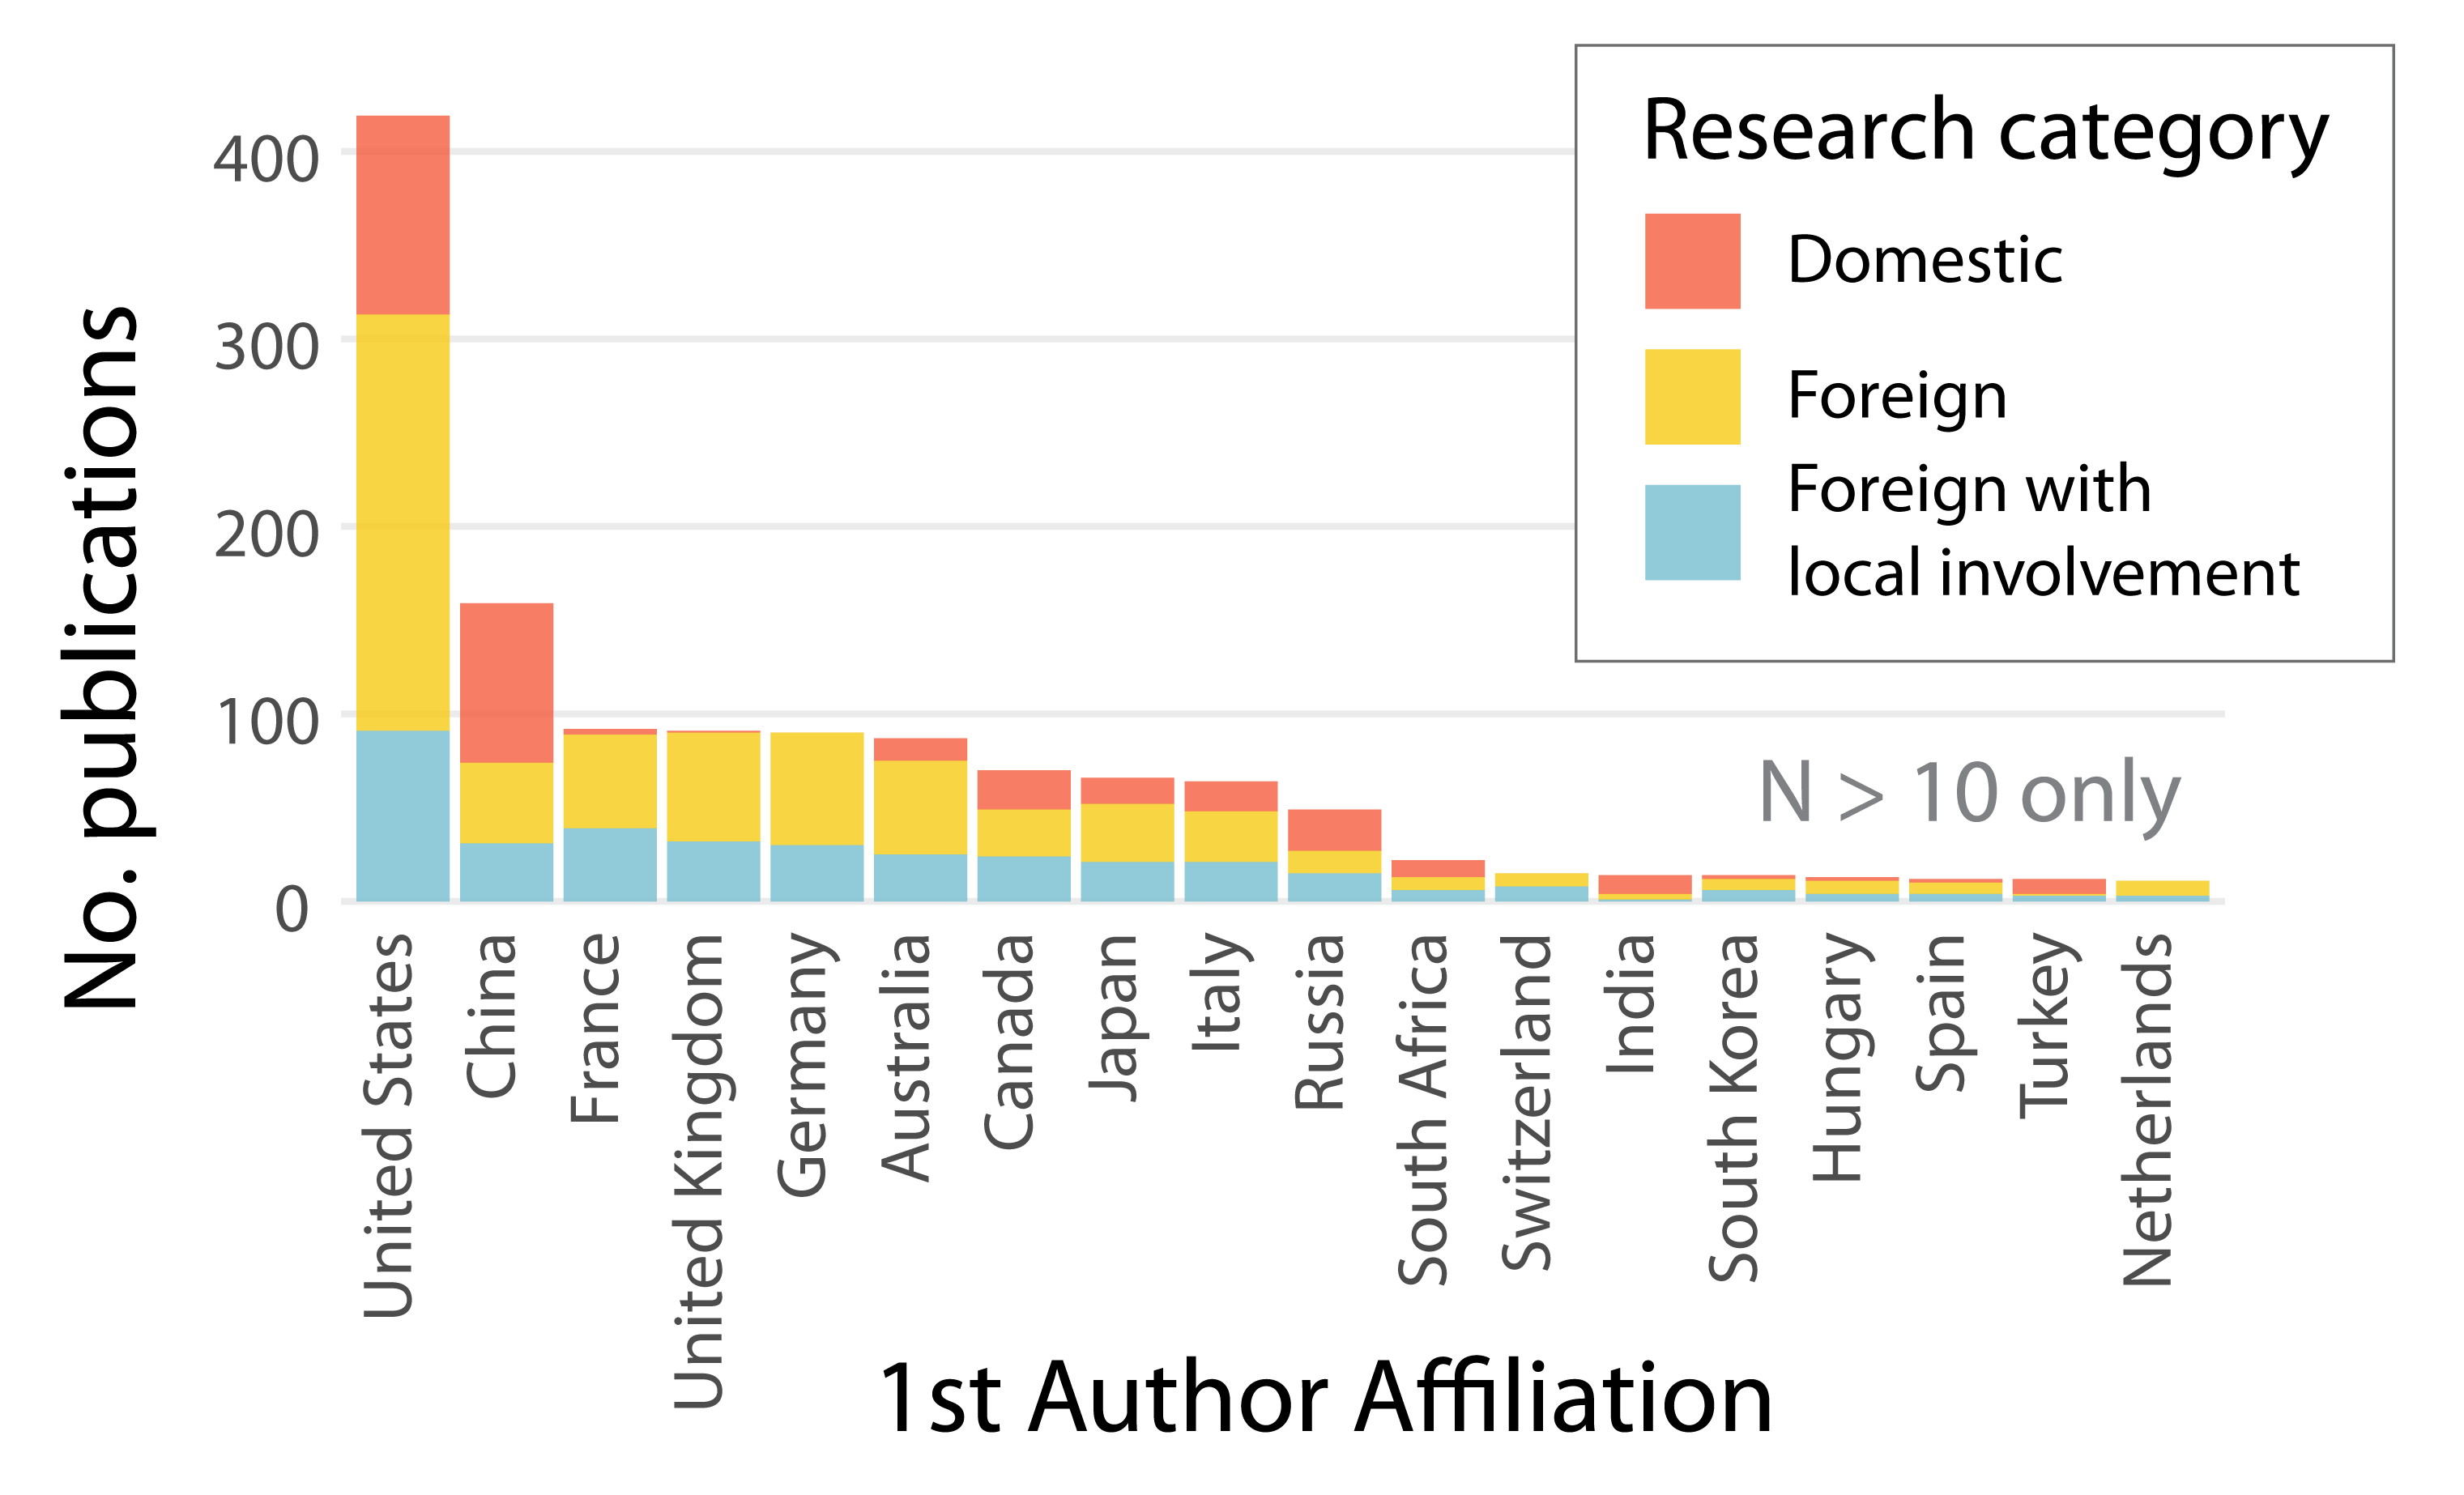
First we plot a bar chart showing the total publications from each country categorised as domestic, foreign or foreign with local involvement:
Is is clear from this chart that foreign research makes up a significant proportion of the publications for most of the countries with the largest numbers of publications (>50 publications). In particular, we can see that domestic research makes up a tiny proportion of the total output from the UK, France and Germany but that these countries have a large number of 1st authored papers, second only to the USA and China.
The USA and China have a somewhat larger proportion of domestic research and are the best represented in the dataset in terms of nubmer of first authored publications.
To look in more detail at the breakdown of research conducted abroad versus domestically we can plot the proportion of foreign research calculated above by country
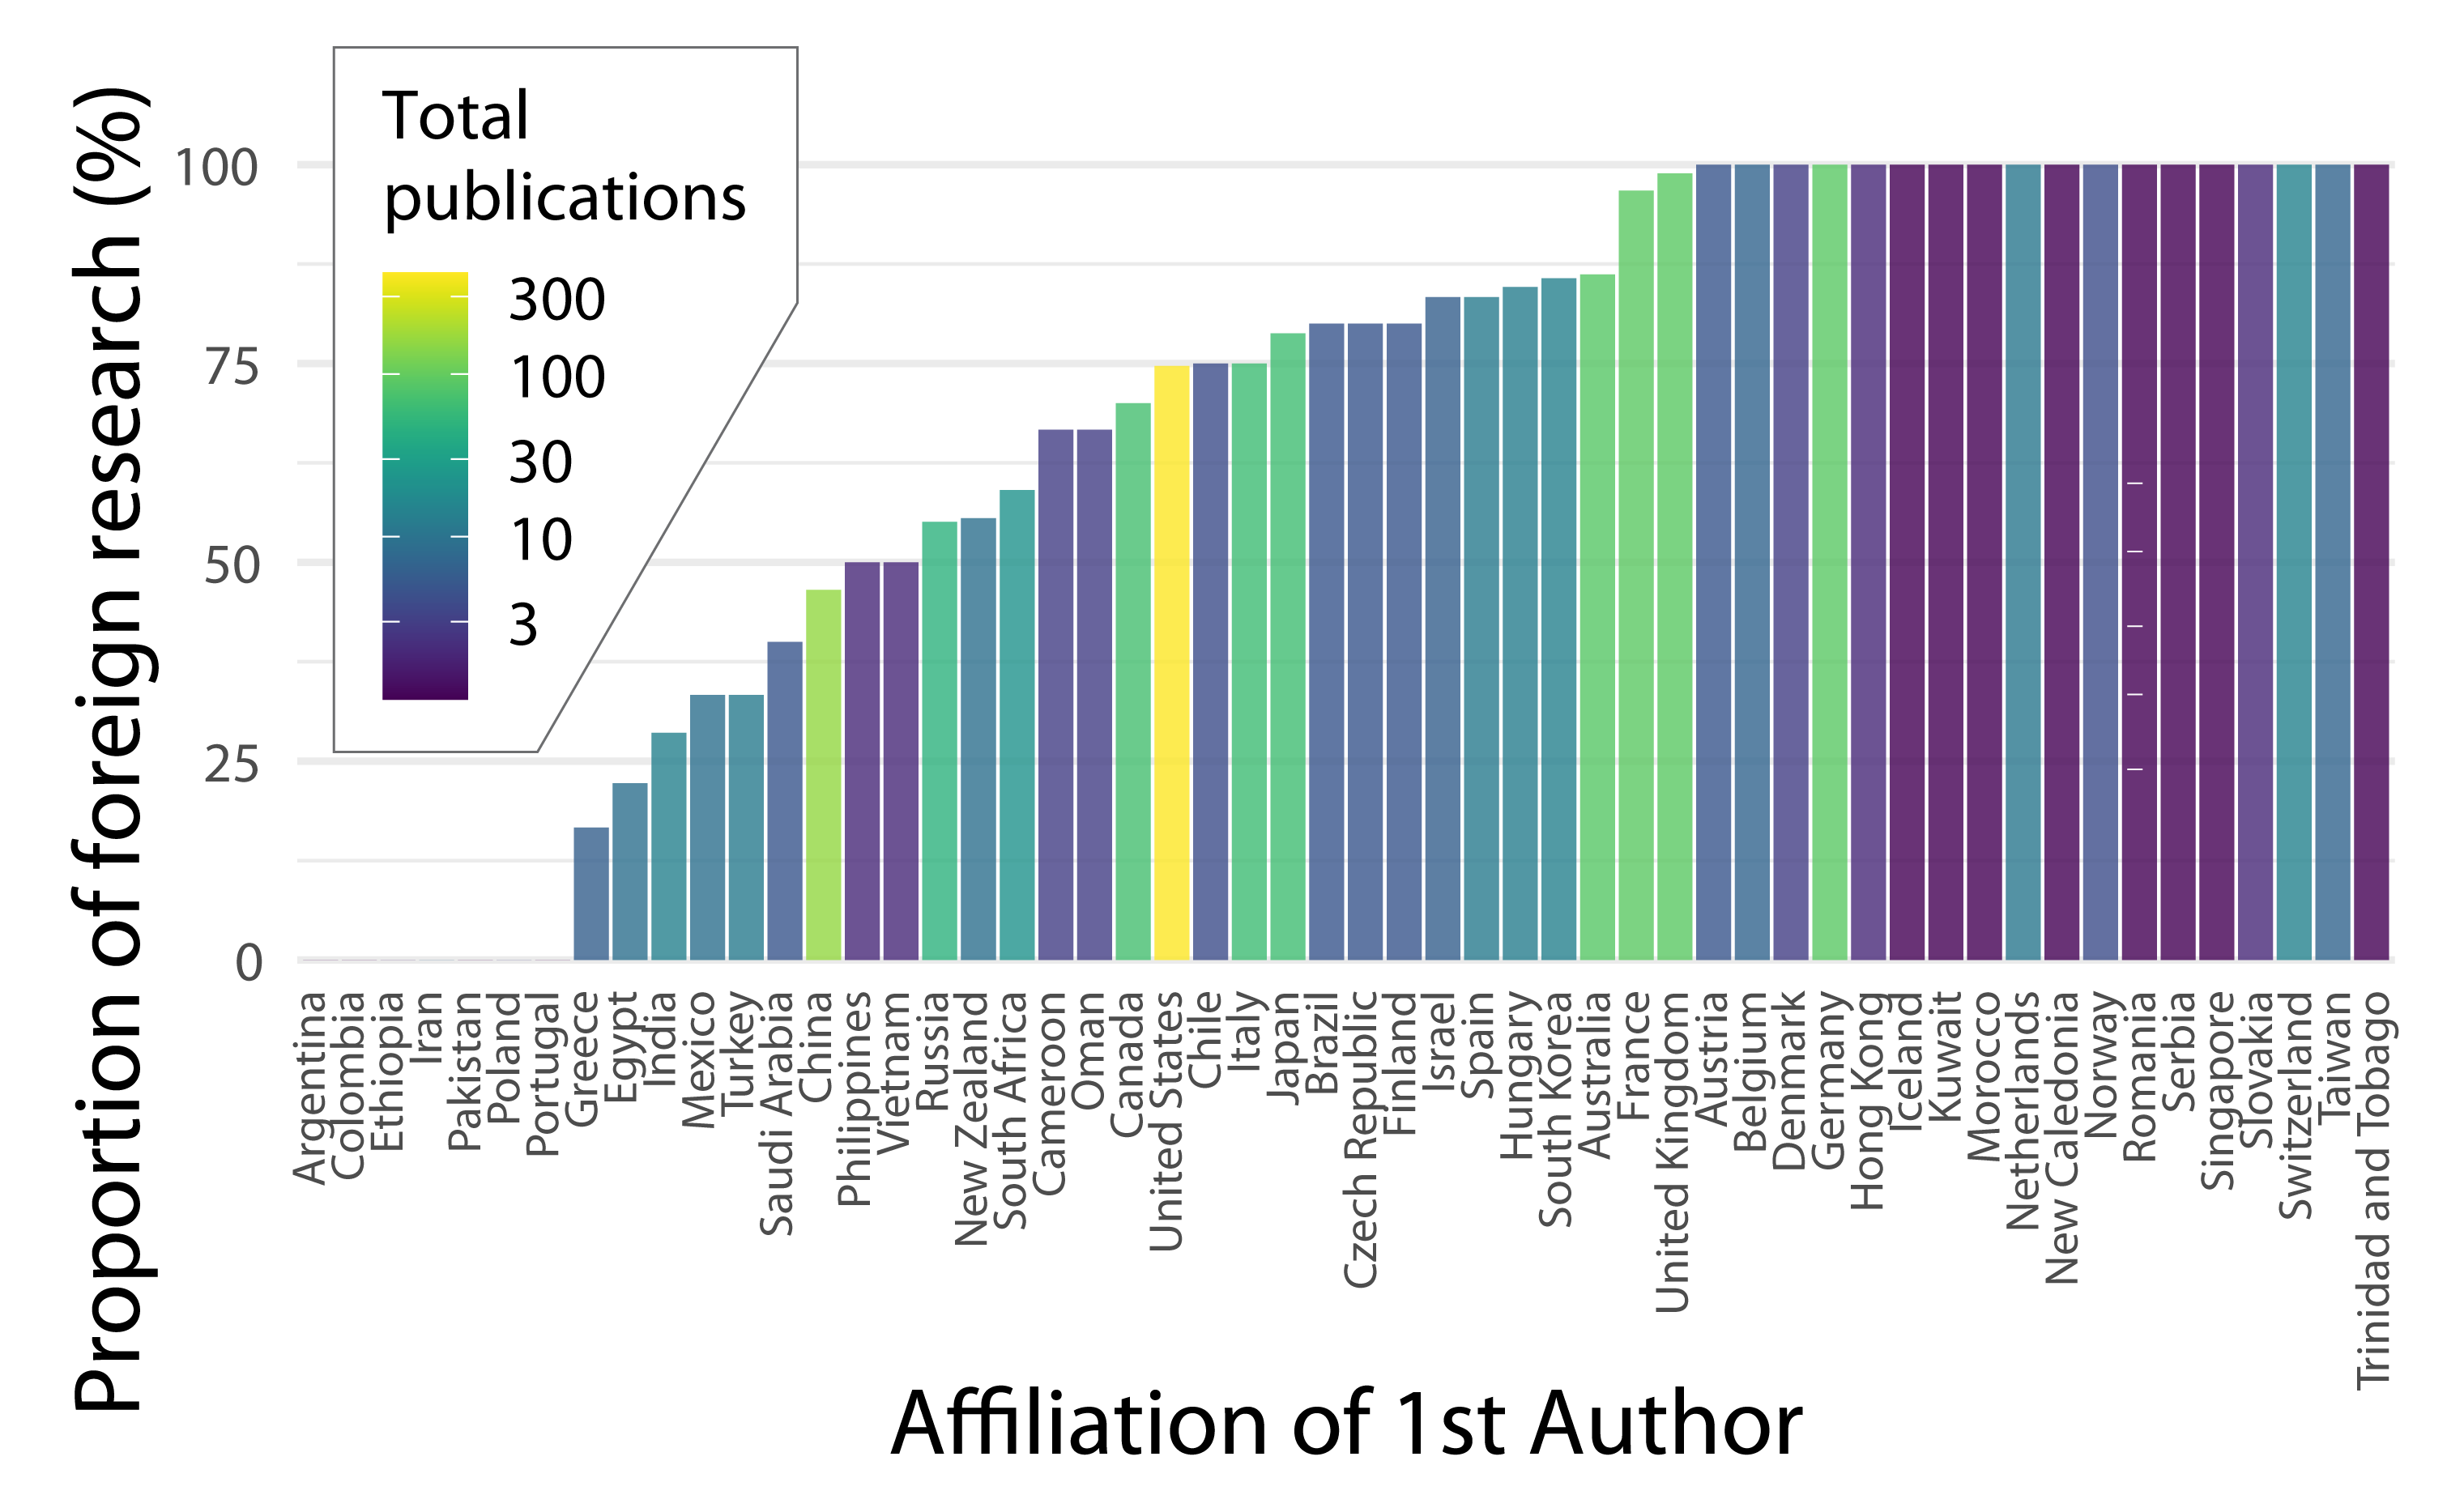
This plot reiterates several of the same features as the previous one. A large proportion of the published outputs from many European countries - including the UK, France and Germany - conduct a large proportion (>75% in most cases) of research abroad.
At the other end of the scale, on the left of the graph, countries with a large proportion of research conducted domestically are more typically in Africa, Asia or South America though Greece and Portugal also feature at this end of the graph.
A number of countries at the right of the graph show 100% of foreign research. Many of these however are represented by only a handful of publications (purple colours) and may not be particularly representative.
Lastly we can look at the proportion of foreign research which includes local collaborators:
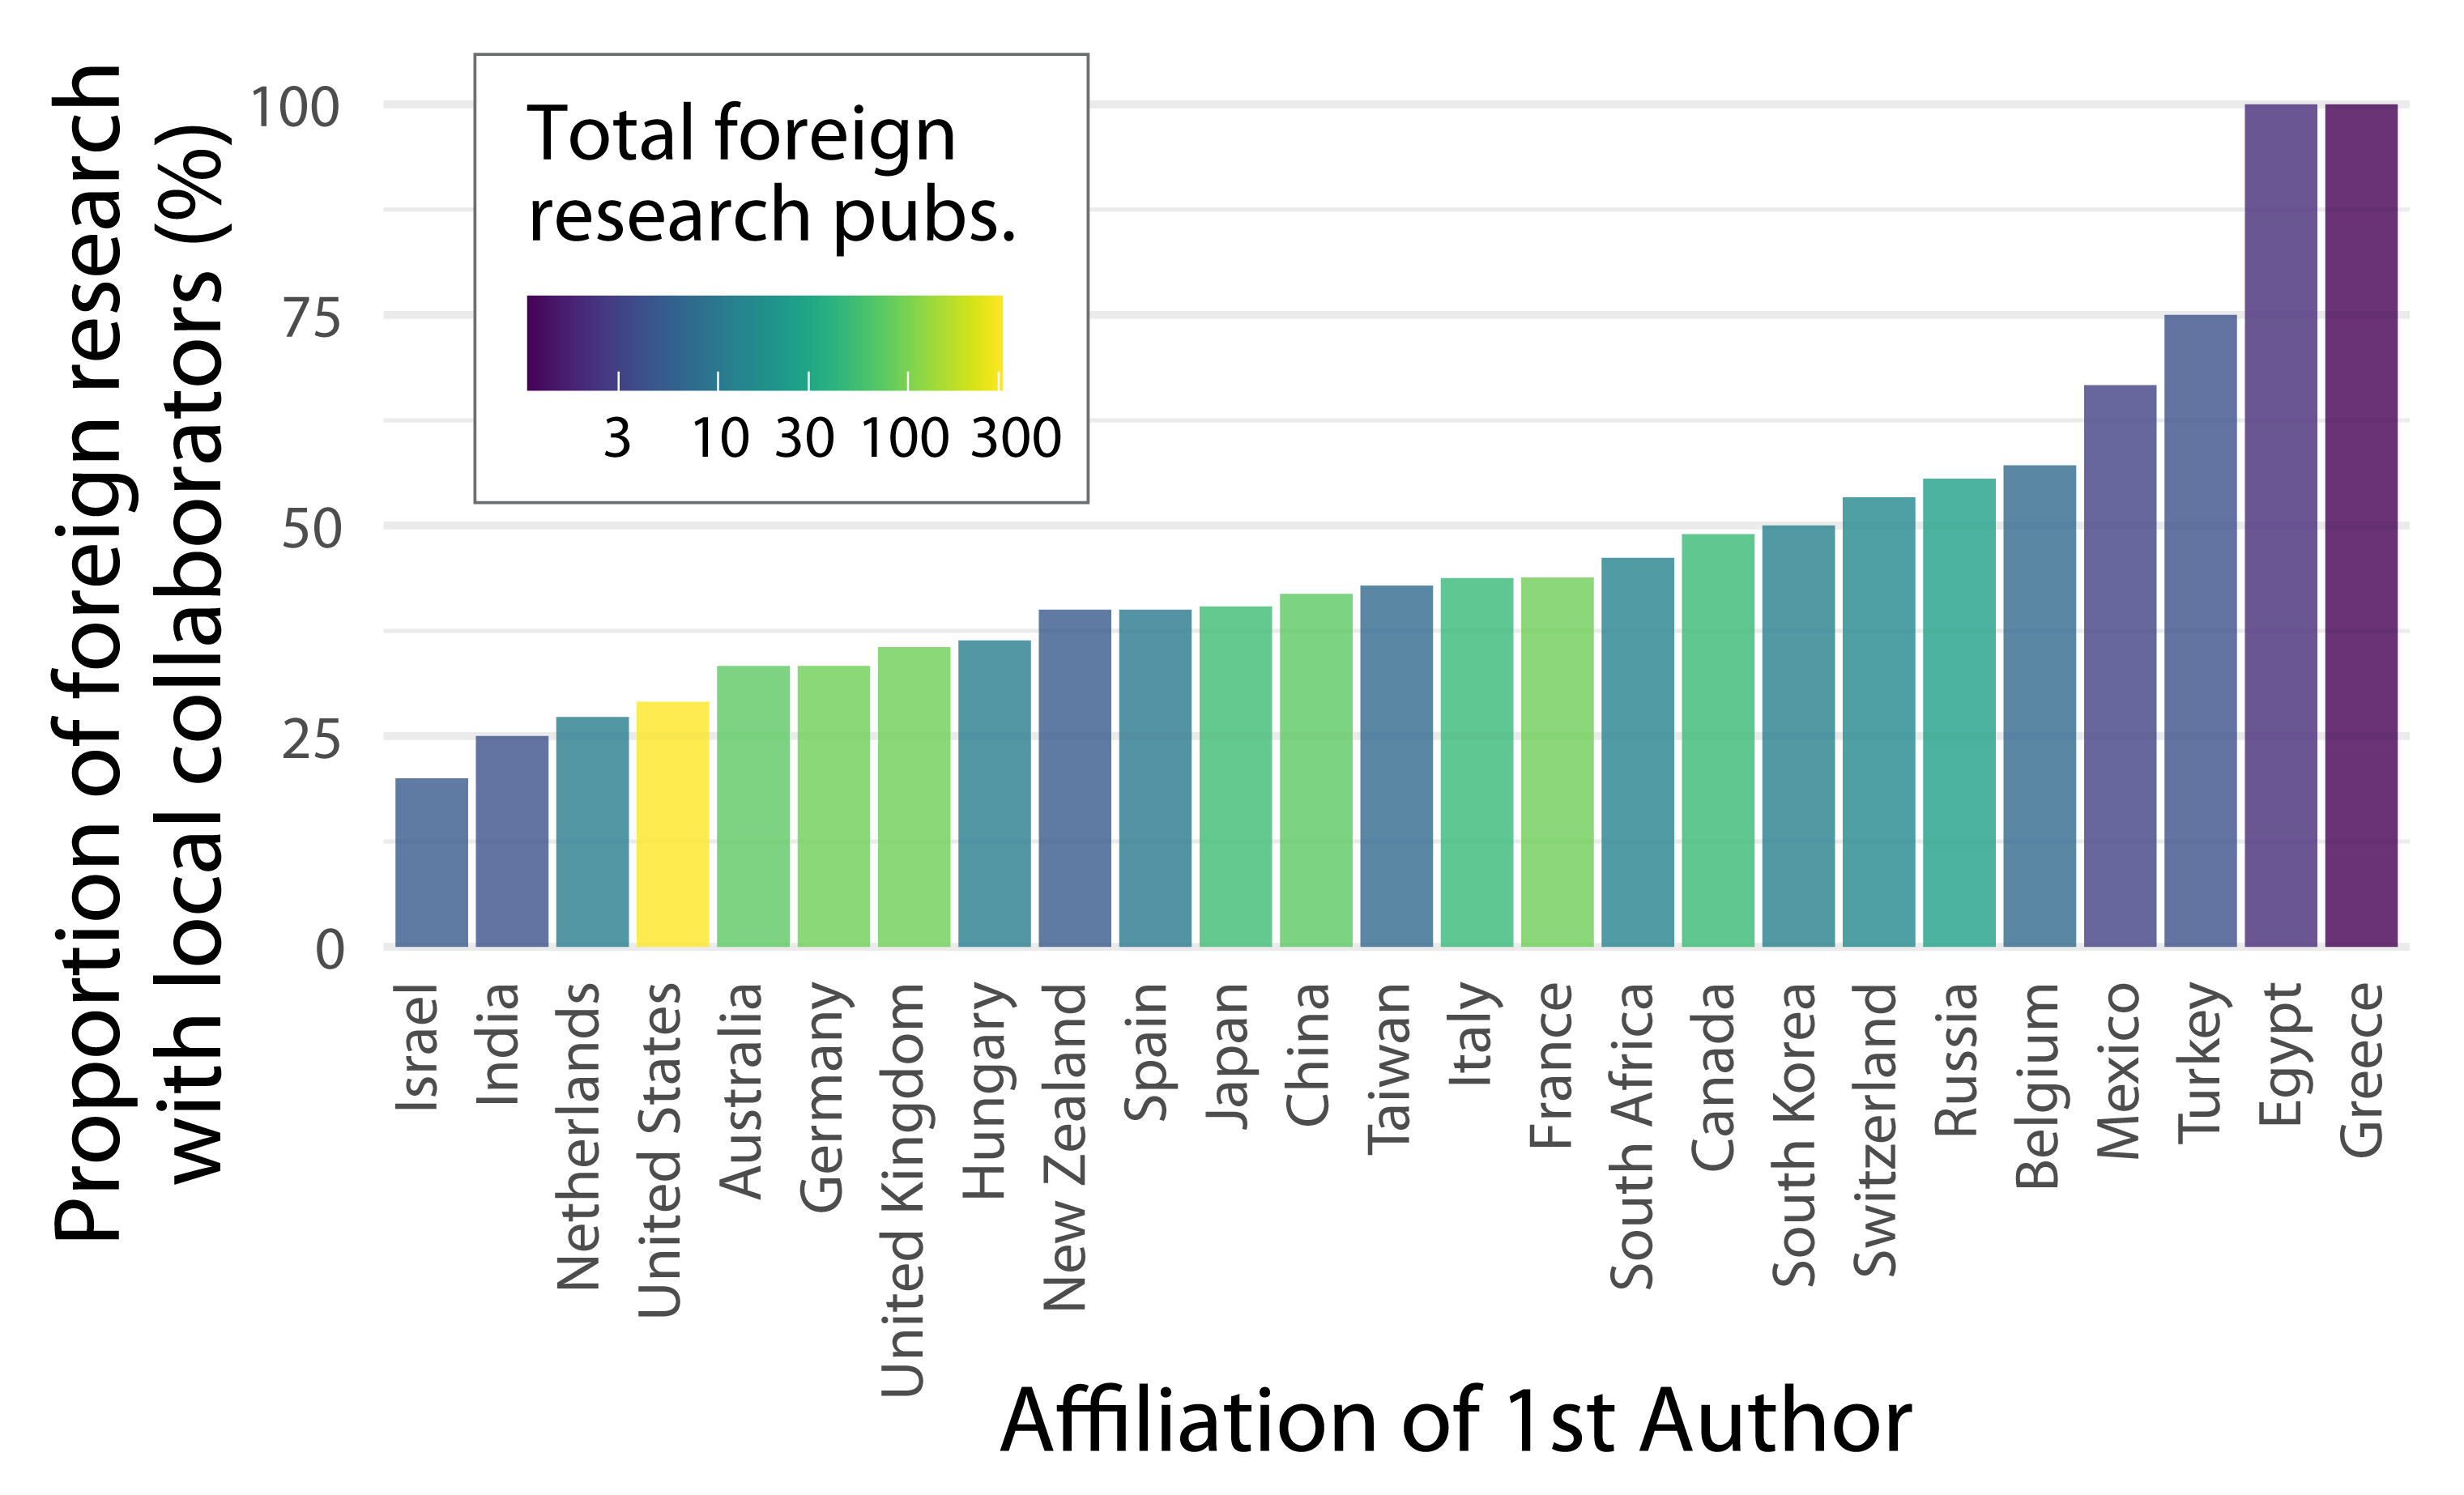
Of countries with a large number of publications based on foreign research (green and yellow colours), the USA, Australia, Germany, United Kingdom show the lowest apparent engagement with local researchers with <30% of publications including a local collaborator. Japan, China, Italy, France, South Africa and Canada are only slightly better with 30-50% of publications featuring a local co-author.
A number of countries with 100% local collaboration have low number of total foreign research publication (purple colours) as in the previous plot and may not be representative.
On the limited data available, Mexico, Brazil, Czech Republic and Eqypt appear to show a high rate of engagement with local collaborators during foreign research. However, more data would be needed to establish this was representative.
Parachute science in analytical geoscience
Altogether these results show strong evidence that parachute science is a phenomenon in analytical geoscience. Though the patterns are not universal the data indicate that the countries undertaking such research are generally richer and include large numbers of European and North American countries. Meanwhile the countries most subject to parachute science tend to be in Central and South America, Africa, the Caribbean and small island nations in Oceania and elsewhere. Furthermore, these regions typically have fewer, or in many cases no, first authored publications despite being well-represented as the subjects of research. This in particular lends support to the argument that gaps in access to analytical facilities may have a direct impact on the research productivity and careers of researchers in many countries.